
Google Ads Data Strength Uplift: What Ecommerce Directors Should Check Before It Goes in the Board Deck
Google Ads is adding a new number to your account: the Data Strength Uplift metric. It tells you how many extra conversions Google thinks your data setup has "recovered".
That sounds like good news, and it can be. But a recovered conversion is a sale that already happened and was missed by your tracking. It is not a new sale. If that difference gets lost on the way to the board deck, you can end up celebrating growth that never reached your bank account.
Here is what Google has actually said, what it has not said, and six checks to run before the number goes into any report.
What changed (in plain English)
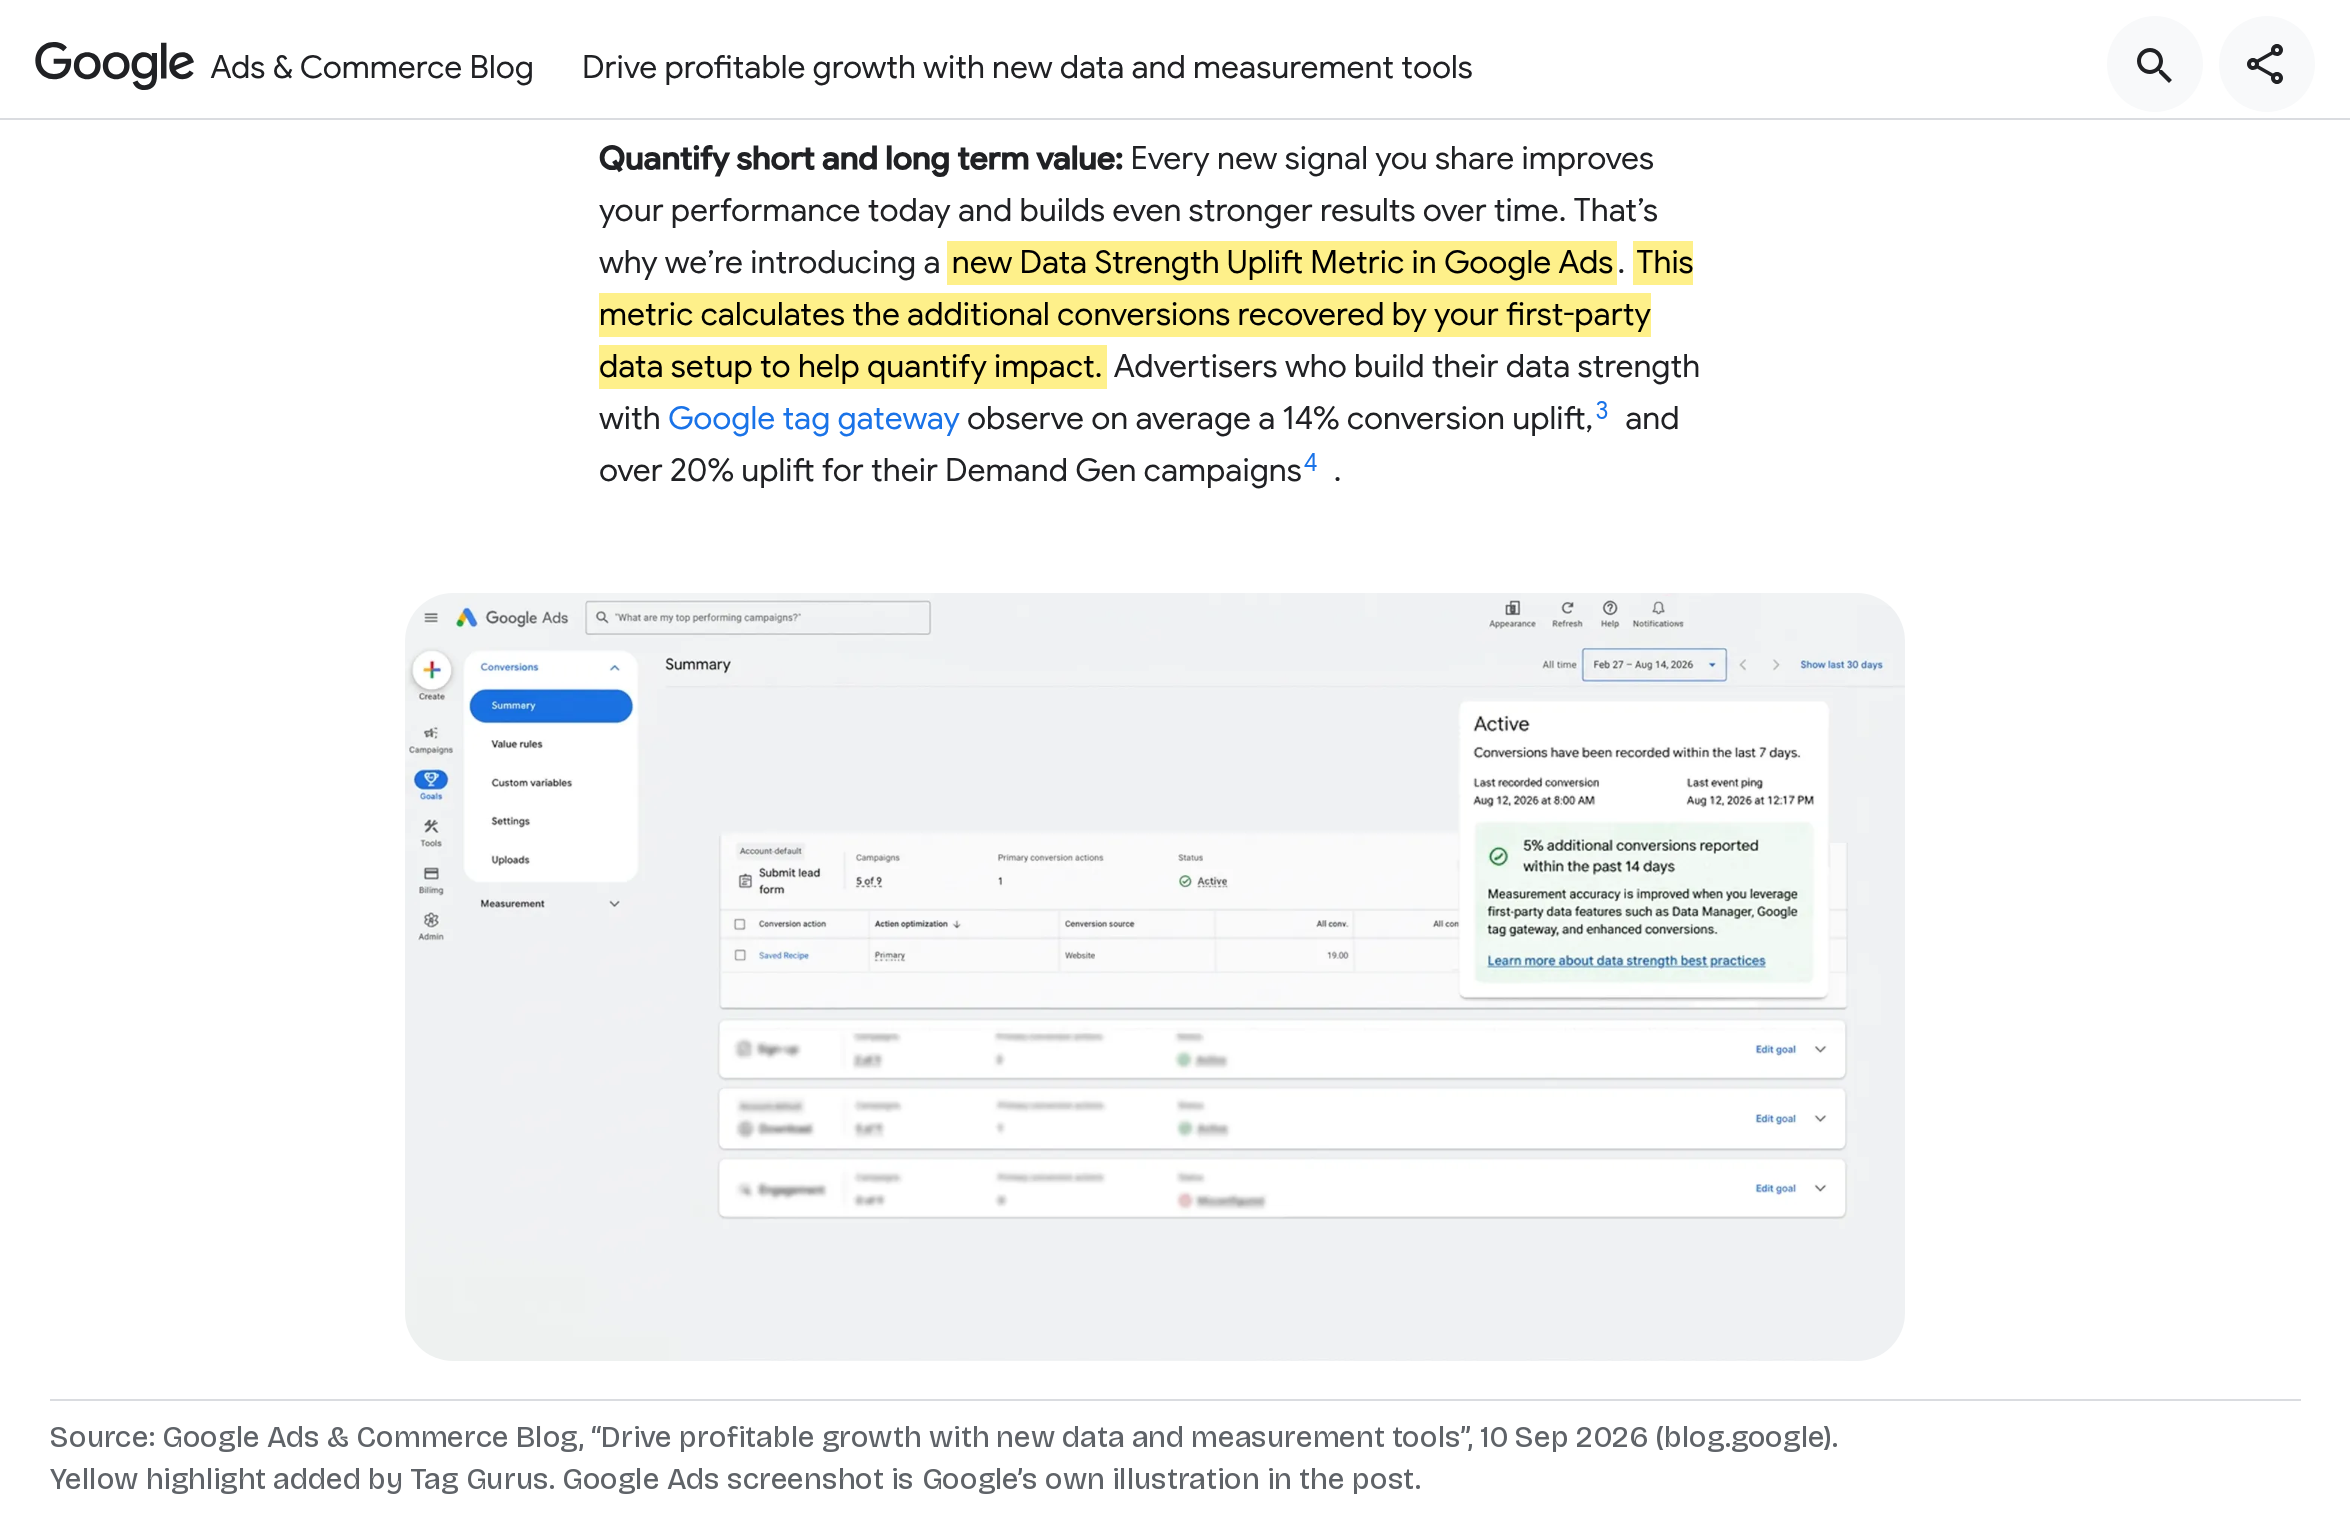
On 10 September 2026, Google announced a set of measurement updates on its Ads & Commerce Blog. One of them was the new metric:
"That's why we're introducing a new Data Strength Uplift Metric in Google Ads. This metric calculates the additional conversions recovered by your first-party data setup to help quantify impact."
Source: Google Ads & Commerce Blog — Drive profitable growth with new data and measurement tools (10 September 2026).
On 13 October 2026, Google's October Demand Gen update repeated it:
"Data Strength Uplift metric is launching in Google Ads, helping you understand the conversion gains driven by your data setup within the Google Ads UI."
Source: Google Ads & Commerce Blog — Build your data strength with October's Demand Gen drop (13 October 2026).
Google's Data Strength best practices guide adds one more detail. It describes the metric as "upcoming" and says it will show "the percentage of recovered conversions driven by your data strength setup in the last 14 days."
Source: Google — Data Strength Best Practices.
In plain English:
- "Data strength" is Google's name for your first-party data setup. That means things like Google tag gateway, enhanced conversions and connecting your order or CRM data through Data Manager.
- The new metric is Google's estimate of what that setup recovered. It is a percentage of conversions over the last 14 days, worked out by Google.
- Recovered is not the same as new. These are conversions your tracking used to miss. The customers were already buying.
Recovered conversions are not new sales
PPC Land, which covered the October update, put it clearly:
"Recovered conversions are conversions that would have happened anyway but were not measured; they are not incremental sales."
Source: PPC Land — Google claims 20% Demand Gen conversion uplift from tag gateway setups (Luis Rijo, 13 October 2026).
PPC Land also noted that when the metric was first presented in September, "Google published no formula and no baseline", and that the October update "adds no methodology."
Seeing more of your real conversions is still useful. Smart Bidding learns from what it can see, so better data can lead to better bidding over time. But the first effect is on your reports, not your revenue.
About Google's headline numbers
Google's posts include some big averages. Here is what they say, and what sits behind them:
- 14% conversion uplift with tag gateway. The September post says advertisers using Google tag gateway "observe on average a 14% conversion uplift". Its footnote reads: "Google Internal Data, Global, Finance, July -Dec 2024 vs Jan-June 2025."
- Over 20% for Demand Gen. Both posts say "over 20%" uplift for Demand Gen campaigns. The September footnote reads: "Google Data, Global, Performance, June 3, 2026, - Jun 17, 2026."
- The Zebra case study. The October post says the insurance platform "implemented data strength to achieve a 16% increase in conversion volume and a 19% increase in overall conversion value." PPC Land points out that the post does not give the time window, baseline or setup.
These are Google's own figures about Google's own products. They may be true on average. They are not a forecast for your store, and they do not separate "we measured more" from "we sold more".
A simple example (illustrative)
This is a made-up example to show the maths, not a real client.
A UK homewares retailer spends £40k a month on Google Ads. In September its backend shows 2,000 online orders. Google Ads reports 1,500 conversions.
In October the team switches on tag gateway and enhanced conversions. Google Ads now reports 1,650 conversions, and the Data Strength Uplift metric says roughly 9% were recovered. The backend still shows about 2,000 orders.
- Reported ROAS in Google Ads goes up.
- Real orders and margin have not moved.
- If the deck says "Google Ads conversions up 10%", it is telling the wrong story.
The right line is: "We now measure about 150 more of the orders we were already getting. Sales are flat. We will judge the real effect on bidding over the next few months."
Director checklist
- Check whether the metric shows in your account. Google calls it "launching" and "upcoming", and has not published rollout dates or which accounts get it. If you cannot see it yet, that is normal.
- Record a baseline before you change anything. Before you switch on tag gateway, enhanced conversions or Data Manager, note conversions, conversion value, ROAS and backend orders for at least the previous four weeks.
- Reconcile against backend orders and margin. Compare Google Ads conversions with your real orders, revenue and margin for the same days. If reported conversions rise and orders don't, you are seeing better measurement, not more sales.
- Treat Google's averages as vendor claims. The 14%, "over 20%" and The Zebra figures come from Google, with narrow or missing details. Don't put them in a forecast.
- Use a proper test for causal proof. If you want to know whether ads (or better data) created extra sales, run a Google Ads Conversion Lift study or a geo experiment with Meridian GeoX, which Google says is now "generally available globally in Meridian".
- Add a note in reports wherever the measurement changed. Mark the date you changed your setup on every chart and in the board deck. Any month-on-month comparison that crosses that date needs a footnote.
Questions to ask your team this week
- Can we see the Data Strength Uplift metric in our Google Ads account yet?
- What did conversions and backend orders look like for the four weeks before we changed our setup?
- When we compare Google Ads with our order system, does the gap get smaller, or do orders actually go up?
- Which reports and dashboards need a "measurement changed on…" note?
Caveats
- Google has not published how the metric is calculated. Treat it as Google's estimate, not an audited number.
- Rollout details are unclear. Google has not said when every account gets it.
- Better data can still help bidding. We are not saying the setup is pointless. We are saying judge it on orders and margin over time, not on the uplift figure alone.
- Consent rules still apply. Tag gateway and enhanced conversions do not change what your cookie banner allows.
Final thoughts
#16/100 — Recovered conversions are sales you already had. Check what the number means before it goes in a board deck.
The Data Strength Uplift metric can be a useful health check on your tracking. It is not a growth figure. Set a baseline, reconcile with your backend, mark the date things changed, and use a lift test when you need proof.
Not sure what your Google Ads conversions really add up to? Run our free GA4 and GTM tracking scan at https://audit.taggurus.co.uk/, email info@taggurus.co.uk, or book a meeting today to discuss.
FAQ
Q: What is the Google Ads Data Strength Uplift metric?
A: A new Google Ads metric that, in Google's words, "calculates the additional conversions recovered by your first-party data setup". Google's guide says it shows the percentage of recovered conversions over the last 14 days.
Q: Does a higher uplift mean we made more sales?
A: No. Recovered conversions are sales that already happened but were not measured before. Check your backend orders to see whether sales actually changed.
Q: Why can't I see it in my account?
A: Google describes it as "launching" and "upcoming" and has not published rollout dates or eligibility. It may not have reached your account yet.
Q: Can we use Google's 14% or 20% figures in our forecast?
A: We would not. They are Google's internal averages with narrow footnotes, not a prediction for your business.
Q: How do we prove real extra sales?
A: Use a controlled test, such as Google Ads Conversion Lift or a geo experiment with Meridian GeoX, and judge the result on orders and margin.
Q: What should we tell the board?
A: That measurement improved on a set date, that some previously missed sales are now counted, and whether backend orders and margin moved. Footnote any comparison that crosses the change date.
Sources
- https://blog.google/products/ads-commerce/data-strength-updates/ (Google Ads & Commerce Blog, 10 September 2026: Data Strength Uplift Metric announcement; 14% and over-20% tag gateway averages with footnotes; Meridian GeoX generally available)
- https://blog.google/products/ads-commerce/demand-gen-drop-october-2026/ (Google Ads & Commerce Blog, 13 October 2026: metric "launching in Google Ads"; The Zebra 16% / 19%)
- https://business.google.com/us/accelerate/resources/articles/data-strength-best-practices-a-deep-dive-into-the-ai-essentials-2/ (Google Data Strength best practices: "upcoming" metric, percentage of recovered conversions over the last 14 days)
- https://ppc.land/google-claims-20-demand-gen-conversion-uplift-from-tag-gateway-setups/ (PPC Land, Luis Rijo, 13 October 2026: recovered ≠ incremental; no formula or baseline published)
